The Bay County Inventory Status ending February 2016

by Wendell Browne on March 9, 2016

Several of the areas that I work in are entering a market cycle of being under supplied in respect to the available inventory. The stats in today’s article will give a broad overall on the Bay County attached and detached single family segment as a whole. The condominium sector is not considered in this analysis.

On a macro level, the attached/detached single family market has stabilized over the last few years with a gradual increase in value starting in 2014. The chart below reflects the value trend on a price per square foot basis as shown by the red line. The days on market (exposure) has dropped over the last four years and is running around 100 days at the present time.

Bay Cty

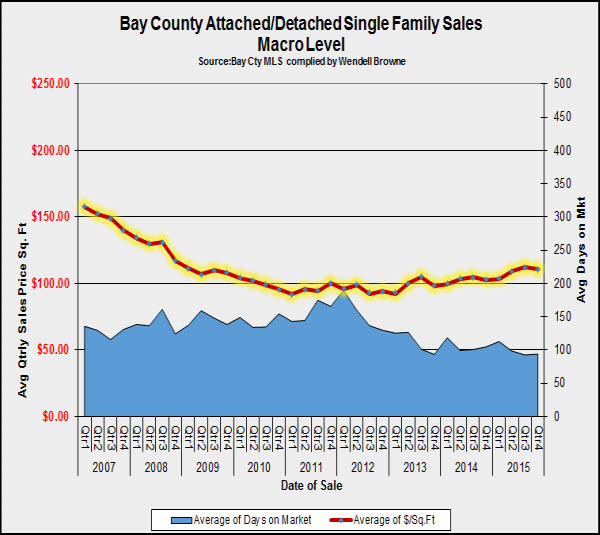
The graph above reflects MLS data from the period of 2007 through 2015. The data and analysis below is based on 12 month trend for the period ending February 29, 2016. During this period, total unit sales were 2,865 compared to 2,620 for the prior 12 month look back period.

MC

During this period, the average sale comprised a gross living area of 1,788 sq. feet with a median gross living area of 1,653 sq. feet.

The chart below breaks down the existing inventory by a specific list price range and also reflects the average size of the property within this range. Note:There is a slight variance in the total active listing count (less than 10 units) based on the lag time between data downloads.


If you are a Seller

Hover over this chart and see how your property compares with the existing inventory. This will give you some insight as to the potential competition you might face.

Are you considering a purchase ?

If you are a potential buyer, then check out the chart to see where the glut of listings are and if that’s in your price range, you’ll likely be able to have some bargaining power based on competitive inventory.

Conclusion

As a whole, inventory levels are at a good balance, 6 months +/-. However this is based on the total market on a macro level and thus some specific areas are undersupplied. The market will likely heat up as Bay County enters the prime sales season and hopefully some fresh inventory will also appear. I hope you’ve enjoyed reading this article and if our office can be of assistance to you with your residential appraisals needs, please visit our website.

To stay current with Bay County real estate market updates, subscribe by email here. Thank you for stopping by.

{ 4 comments }

Unemployment and The Bay County Real Estate Market

by Wendell Browne on March 1, 2016

Bay County has experienced unemployment issues over the last 8+ years like many areas. The unemployment rate peaked in January of 2011 reaching some 12.5%. Over the last five years, the unemployment rate has gradually decreased and held steady during the last six months of 2015. Bay County closed out 2015 with a 5.1% unemployment rate.

One of the things that I noticed in looking at the local stats I maintain, is while the area has experienced a decline in the unemployment rate, the work force has also decreased. Yes, our area is subject to a seasonal influx and thus the swing in numbers in the labor force can vary, but still, some of the numbers I see suggest a diminishing labor force which is not good for the housing market. (As you view the charts below, you can adjust the slider on either side to zoom in or out.)


To further analyze this, I’ve looked at the data over the last five years from a Quarterly basis perspective and the numbers support the same – decline in the labor force. The data indicates a consistent jump in the labor force in Quarters 2 and 3 on an annual basis. This is to be expected given the seasonal trends of Panama City Beach and the additional jobs created during the peak tourism season.


In summation, while the Bay County residential market continues to regain ground from prior losses experienced after the housing crash, this ingredient will be a key part of the housing recipe in the next few years moving forward.

{ 2 comments }

The detached single family market segment on Panama City Beach cooled down in January after experiencing a heavy sales volume closing out 2015. Overall sales volume during 2015 increased 18% as compared to 2014 with a modest appreciation of some 4% contrasting the prior 12 month period.

The annual sales volume has increased year over year for the last several years and has increased an astounding 80+% since 2010. This is certainly good news for our market as it continues to recover.

With this post, I am incorporating some new charts to my toolbox that will be dynamic and interactive. As you view the charts, you can 1) hover and move your mouse over the chart to see the specific data, 2) left mouse click and zoom in to a specific time period and you can 3) left click on the legend to eliminate a specific data series. So, for example, if you would like to view only the price per square foot on the chart, click the #sales in the legend and then you can view this series alone.


I hope you enjoy the new charting features. They are of course a work in progress, so stay tuned for more to come. If you like the charts or have any comments, drop me a note in the comments section.


As always, Thanks for reading and for all of your professional appraisal needs, visit our website.

{ 4 comments }

The Panama City Beach Condominium Market

February 15, 2016

Tweet Today’s post will review the current condominium market on Panama City Beach and will also take a peak of historical market trends experienced by this market segment since 2003. As I’ve written in the past, it’s important to recognize how your investment is performing long term vs the expectations of a large instant equity […]

Read the full article →

Derby Woods Subdivision -A 15 year view

February 3, 2016

Tweet Derby Woods is a single family residential development in Lynn Haven, Fl. offering homes that were built in the late 70’s and early 1980’s. The predominant age of homes in the subdivision were built in mid 1980’s. The project features a mixture of homes ranging from approximately 1,500 square feet to 3,000 square feet […]

Read the full article →

The State of the Market–Callaway

January 25, 2016

Tweet The Callaway market locale has experienced correction and decline after peaking in early 2005. The area experienced continual market decline from 2006 through 2013. Since 2013, the median sales price and overall price per sq. foot has fluctuated, however during 2015, 3 of the 4 Quarter periods returned positive results. Overall sales activity was […]

Read the full article →

A Historical Overview of the Market–Lynn Haven, FL

January 11, 2016

Tweet Today let’s take a walk thru time and see how the Lynn Haven, FL single family market is performing. This analysis is based on MLS data from 2002 through 2015. The single family segment of Lynn Haven experienced a significant increase in values from the period of 2002-2006.  This market area peaked in mid […]

Read the full article →

Welcome to 2016

January 6, 2016

Tweet Good Morning Everyone and Welcome to the New Year ! I’m excited about 2016 and what it will bring for the Bay County, FL marketplace. For 2015, positive gains were measured in many of the areas that comprise our residential marketplace.                         The […]

Read the full article →

A Historical View of Panama City Beach Condos

October 14, 2013

Tweet Have you been wondering about that condo investment you made on Panama City Beach? One thing that is important to recognize is how that investment is performing over the long haul, i.e. 7-10 years down the road as opposed to buying a property with the expectation of making a fortune 6-12 months later. The […]

Read the full article →

The Winds of Change – Lynn Haven, FL

October 10, 2013

Tweet Have the winds of change swept through Lynn Haven, Fl and ended the decline of single family property values ? The chart below reflects single family homes on a per sq. ft. basis on a macro level since 2002. The vertical bars running from the left axis reflect the sq.ft. indicator for each Quarter […]

Read the full article →