Have the winds of change swept through Lynn Haven, Fl and ended the decline of single family property values ?
The chart below reflects single family homes on a per sq. ft. basis on a macro level since 2002. The vertical bars running from the left axis reflect the sq.ft. indicator for each Quarter period. The green bar would reflect an increase for the Quarter period in comparison to the previous 12 month Quarter period. I have highlighted the Quarter periods in red that would reflect a decline for that Quarter period.
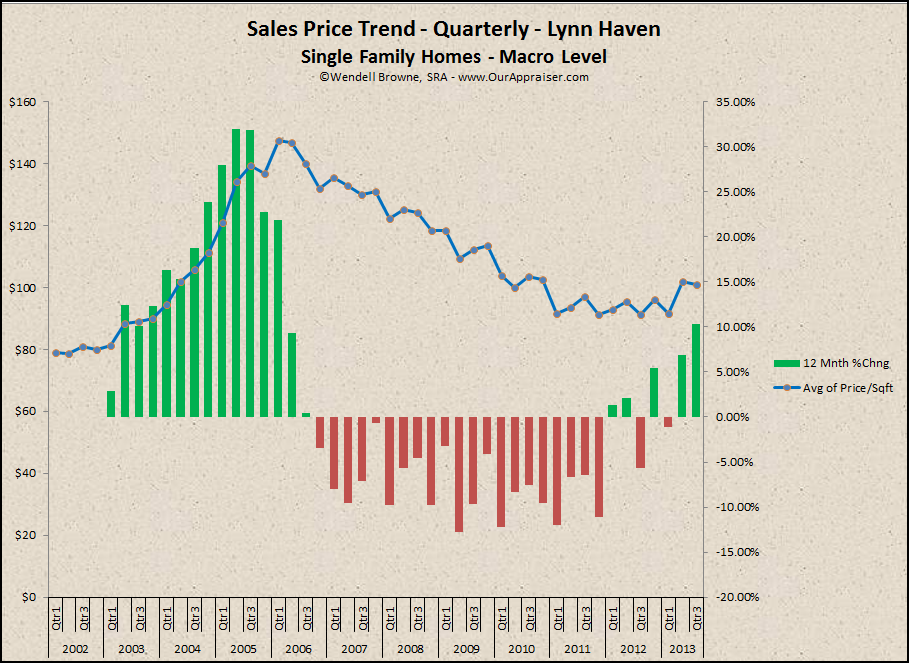
It’s easy to recognize that Lynn Haven experienced a run-up that peaked in early 2006 and steadily declined through 2011. In 2012, three of the four Quarters experienced a positive return and thus far in 2013, the same results are indicated. This is a good sign for the area and with the continual absorption of the standing inventory; this area is on the right track to recovery.