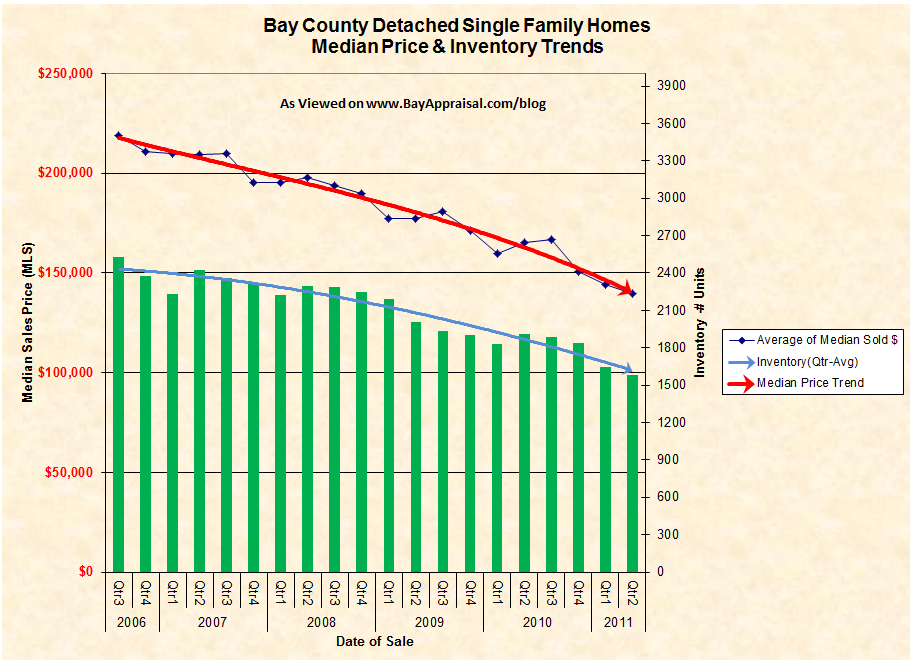
The median sales price of single family properties in Bay County continued to slide downward for the 2nd Quarter of 2011. As noted from the trend line graph below, both 1st and 2nd Qtr periods declined from prior 12 month levels.
While market correction continues to take place, overall sales volume was up for the 2nd Qtr period and a significant reduction in the standing inventory took place during this Quarter period.


The second graph reflects existing inventory levels of this market segment, the sold inventory, and the existing supply in months based on the absorption of sales. As you will note, there is still an oversupply of inventory for the area.
If you are in need of appraisal services, trend line analysis, or any appraisal needs, please visit our main website.


{ 2 comments… read them below or add one }
Interesting graphs. It is really amazing to see the inventory levels from 2006 and that Q2 of this year has the lowest supply of homes since 2006. I wonder if the inventory levels ever get down to a 6 month supply.
Bryan, The Good news is that inventory levels are slowly but surely being absorbed. Yes, there was a time that our single family market ran a balanced 6 month inventory level (2005). Starting around the 3rd Qtr of 05′, inventory levels jumped 40+% and have continued to be oversupplied. Thanks for the comment.