Several of the areas that I work in are entering a market cycle of being under supplied in respect to the available inventory. The stats in today’s article will give a broad overall on the Bay County attached and detached single family segment as a whole. The condominium sector is not considered in this analysis.
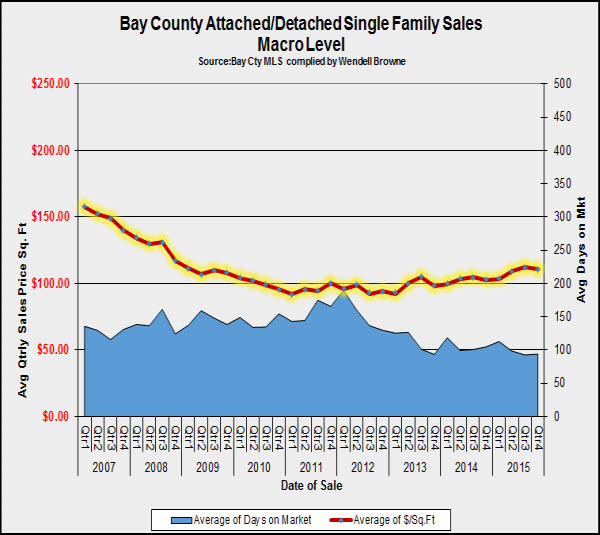
On a macro level, the attached/detached single family market has stabilized over the last few years with a gradual increase in value starting in 2014. The chart below reflects the value trend on a price per square foot basis as shown by the red line. The days on market (exposure) has dropped over the last four years and is running around 100 days at the present time.
The graph above reflects MLS data from the period of 2007 through 2015. The data and analysis below is based on 12 month trend for the period ending February 29, 2016. During this period, total unit sales were 2,865 compared to 2,620 for the prior 12 month look back period.
During this period, the average sale comprised a gross living area of 1,788 sq. feet with a median gross living area of 1,653 sq. feet.
The chart below breaks down the existing inventory by a specific list price range and also reflects the average size of the property within this range. Note:There is a slight variance in the total active listing count (less than 10 units) based on the lag time between data downloads.
If you are a Seller
Hover over this chart and see how your property compares with the existing inventory. This will give you some insight as to the potential competition you might face.
Are you considering a purchase ?
If you are a potential buyer, then check out the chart to see where the glut of listings are and if that’s in your price range, you’ll likely be able to have some bargaining power based on competitive inventory.
Conclusion
As a whole, inventory levels are at a good balance, 6 months +/-. However this is based on the total market on a macro level and thus some specific areas are undersupplied. The market will likely heat up as Bay County enters the prime sales season and hopefully some fresh inventory will also appear. I hope you’ve enjoyed reading this article and if our office can be of assistance to you with your residential appraisals needs, please visit our website.
To stay current with Bay County real estate market updates, subscribe by email here. Thank you for stopping by.


{ 4 comments… read them below or add one }
Great info. Wendell for buyers and sellers in the Panama City market. Love the interactive chart.
Thanks for reading, Tom. I’m glad you like the interactive graph. Still working on a few tweaks on the formatting side.
I really dig the chart with inventory by price level. This is a perfect reminder there are many markets within a local real estate market. Trends are not fluid in that we might see different dynamics happening in various price ranges and neighborhoods.
Thank you Ryan ! You’re are so right about the dynamics of the marketplace and your comment is an excellent point. The kinetics of one submarket or neighborhood can be completely different from others. One size certainly does not fit all in real estate. Appreciate you stopping by.